 Geneva – The World Meteorological Organization’s Statement on the Status of the Global Climate says that 2012 joined the ten previous years as one of the warmest – at ninth place – on record despite the cooling influence of a La Niña episode early in the year.
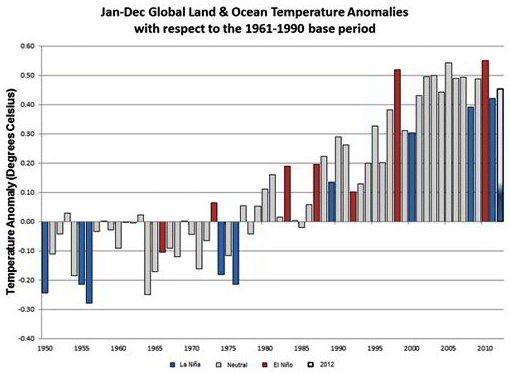
The 2012 global land and ocean surface temperature during January-December 2012 is estimated to be 0.45°C (±0.11°C) above the 1961-1990 average of 14.0°C. This is the ninth warmest year since records began in 1850 and the 27th consecutive year that the global land and ocean temperatures were above the 1961-1990 average, according to the statement. The years 2001-2012 were all among the top 13 warmest years on record.
“Although the rate of warming varies from year to year due to natural variability caused by the El Niño cycle, volcanic eruptions and other phenomena, the sustained warming of the lower atmosphere is a worrisome sign,” said WMO Secretary-General Michel Jarraud. “The continued upward trend in atmospheric concentrations of greenhouse gases and the consequent increased radiative forcing of the Earth’s atmosphere confirm that the warming will continue,” he said.
“The record loss of Arctic sea ice in August-September – 18% less than the previous record low of 2007 of 4.17 million km2 – was also a disturbing sign of climate change,” said Mr. Jarraud. “The year 2012 saw many other extremes as well, such as droughts and tropical cyclones. Natural climate variability has always resulted in such extremes, but the physical characteristics of extreme weather and climate events are being increasingly shaped by climate change,” he said.
“For example, because global sea levels are now about 20 cm higher than they were in 1880, storms such as Hurricane Sandy are bringing more coastal flooding than they would have otherwise,” said Mr Jarraud.
WMO’s annual statements gather the key climate events of each year. The series stands today as an internationally recognized authoritative source of information about temperatures, precipitation, extreme weather events, tropical cyclones, and sea ice extent. The newly released statement provided in-depth analysis of regional trends as part of a WMO drive to provide more information at regional and national levels to support adaptation to climate variability and change.
The 2012 climate assessment is the most detailed to date.
Above-Average Temperatures were observed during 2012 across most of the globe’s land surface areas, most notably North America, southern Europe, western Russia, parts of northern Africa and southern South America. Nonetheless, cooler-than-average conditions were observed across Alaska, parts of northern and eastern Australia, and central Asia.
Precipitation across the globe was slightly above the 1961-1990 long-term average. There were drier-than-average conditions across much of the central United States, northern Mexico, northeastern Brazil, central Russia, and south-central Australia. Wetter-than-average conditions were present across northern Europe, western Africa, north-central Argentina, western Alaska, and most of northern China.
Snow Cover extent in North America during the 2011/2012 winter was below average, resulting in the fourth smallest winter snow cover extent on record, according to data from the Global Snow Laboratory. This was in marked contrast to the previous two winters (2009/2010 and 2010/2011), which had the largest and third largest snow cover extent, respectively, since records began in 1966.
Meanwhile, the Eurasian continent snow cover extent during the winter was above average, resulting in the fourth largest snow cover extent on record. Overall, the northern hemisphere snow cover extent was above average – 590000 km2 above the average of 45.2 million km2 – and was the fourteenth largest snow cover extent on record.
Greenland Ice Sheet: In early July, the Greenland ice cover experienced surface melting at an unprecedented extent, with an estimated 97 per cent of the ice sheet being affected by surface melting in mid-July. This was the largest surface melt extent since satellite records began 34 years ago. During the summer, it is typical to observe surface melting on nearly half of the area of the Greenland’s ice sheet, particularly across the lower elevations. However, in 2012, a high-pressure system brought warmer-than-average conditions to Greenland, which caused this exceptional melting.
Arctic Sea Ice Extent reached its record lowest level in its annual cycle on 16 September at 3.41 million km2. This value broke the previous record low set on 18 September 2007 by 18 per cent. It was 49 per cent or nearly 3.3 million km2 below the 1979-2000 average minimum. The difference between the maximum Arctic sea ice extent on 20 March and the lowest minimum extent on 16 September was 11.83 million km2 – the largest seasonal sea ice extent loss in the 34-year satellite record.


